as a function of wavelength.
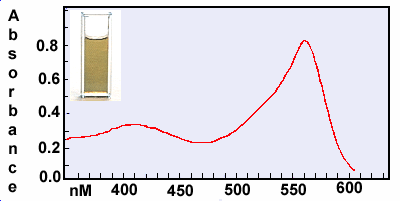
Here is a plot of absorption of the blue form of the indicator
as a function of wavelength.
The spectrum has two peaks because both the yellow and
blue forms are present in the solution.
Next, let's have the computer show the curves for the two forms
and how they add up to give the observed curve.


