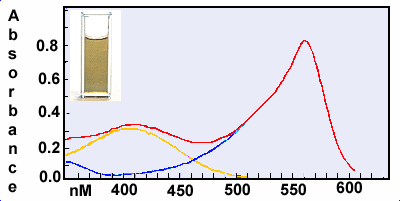
This plot shows how the absorbance of the blue and yellow
forms of the indicator add together to give the observed curve.
In the experiment you will see how the relative amounts of the
blue and yellow forms of the indicator depend on the acidity
of the solution. The measurements will allow us to calculate
an equilibrium constant for the indicator.


(c) Copyright 2000. All rights reserved.