| |
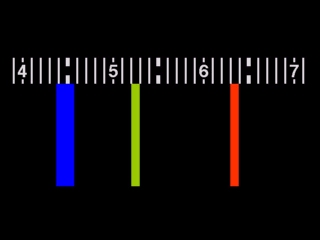
IMAGE. An emission spectrum with a blue line at about 445 nm, a green line at 525 nm, and a red line at 635 nm.
|
The emission spectrum is a result of the excitation of an electron and its subsequent return to the ground state. Since elements have their own distinct allowable excitation levels, each element will have its own distinct emission spectrum.
Because of this uniqueness, an emission spectrum is like a fingerprint. Thus, it is important to accurately record the the wavelength and appearance of each emission. The emission lines can be sketched or tabulated.
Regardless of how the data is organized, careful notes should be taken. Some lines will be very intense or very weak, other lines may appear as singlets, doublets, or multiplets. Since some spectra contain a large number of lines, it is often convenient to develop a set of abbreviations for the appearance of the emission lines. Some common abbreviations are listed below.
Common abbreviations
s - singlet
d - doublet
t - triplet
h - high intensity line
m - medium intensity line
l - low intensity line
|